Klarismo
UX/UI design, front-end development,
MRI imaging and data visualisation, D3.js
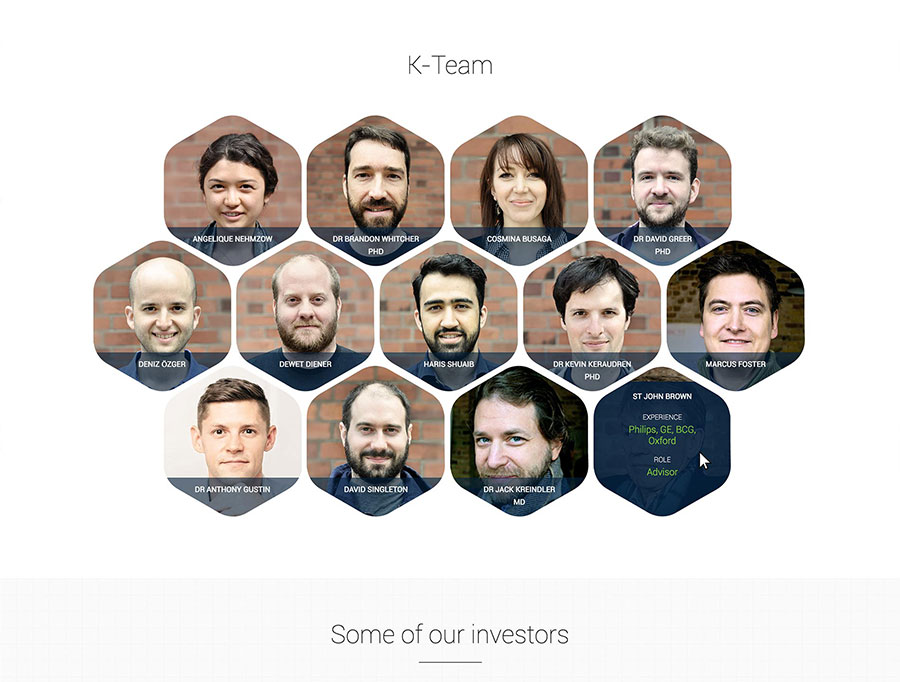
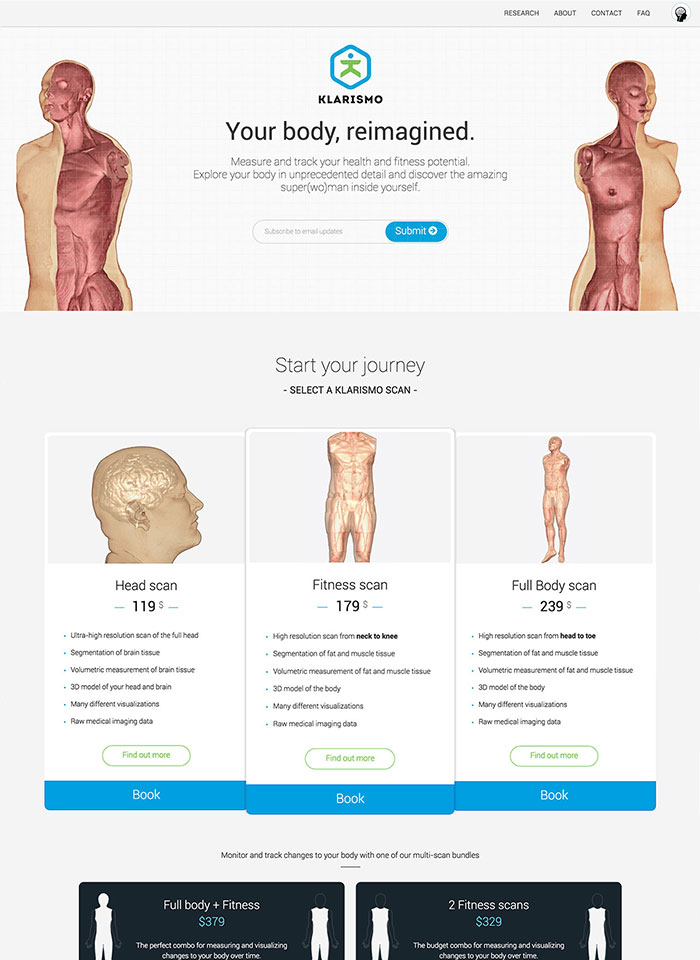
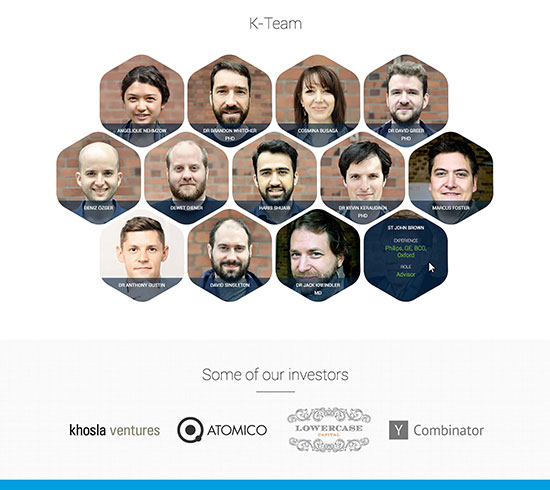
Over the past year I've been part of Klarismo, where I was very lucky to be working with amazing and talented people on one ambitious goal: to create a ‘revolutionary’ product that offers a new way to explore your physiology and understand your body’s composition, using MRI technlogy.
I was in charge with everything linked to design and visualisation from sketch, design, prototype and front-end development, to 3D renderings and MRIcroGL scripts. The main application and the website were fully responsive (phones, tablets, and desktop).
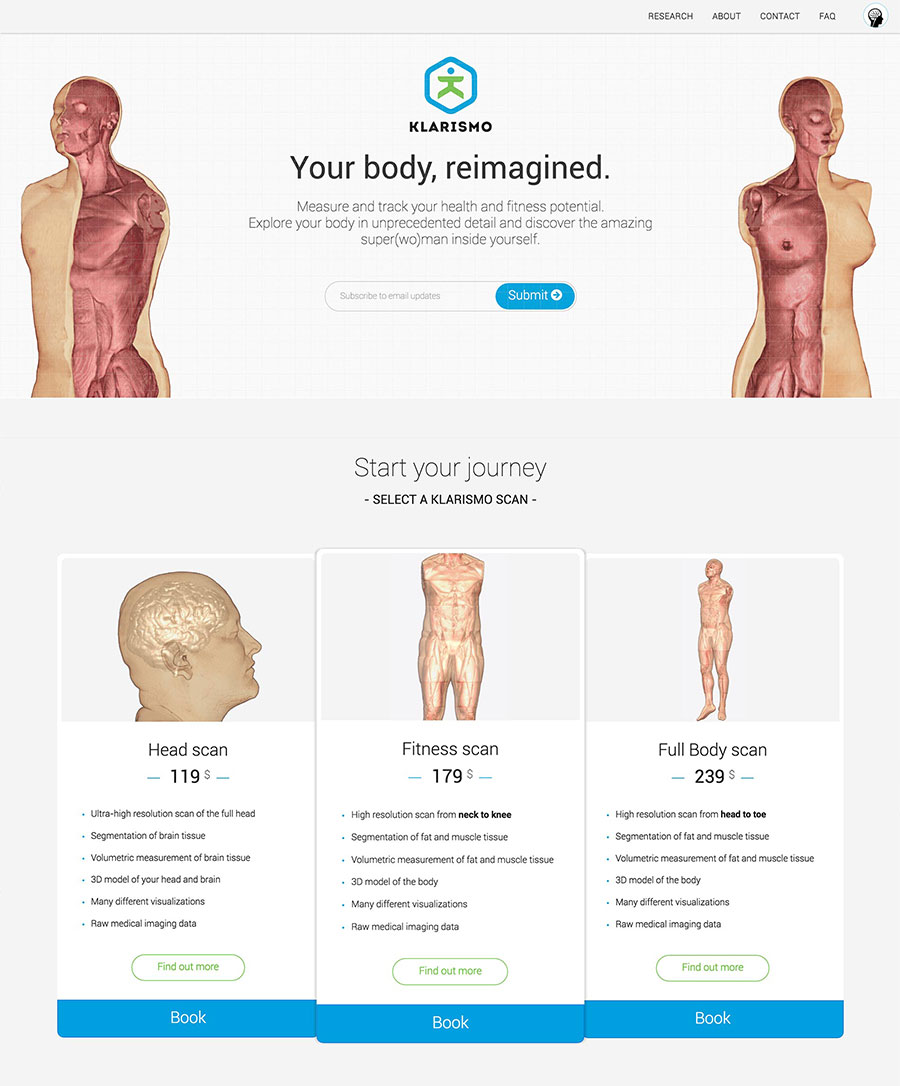
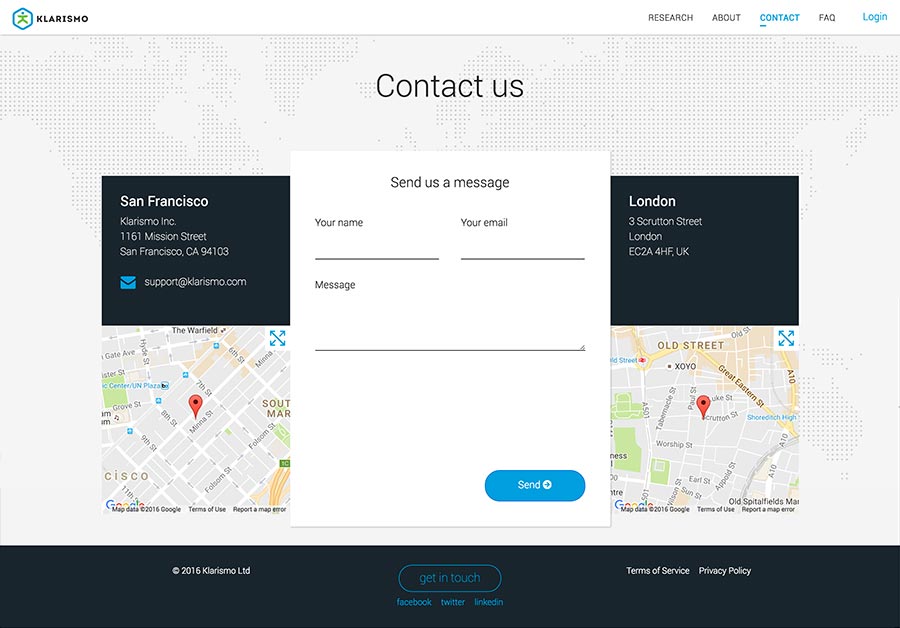
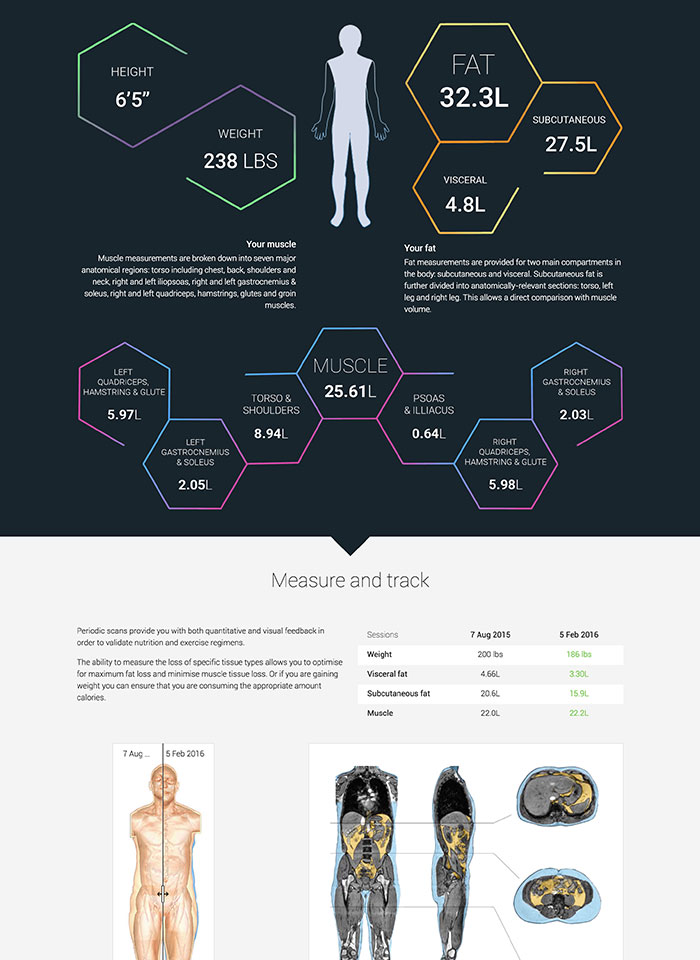
Website shots
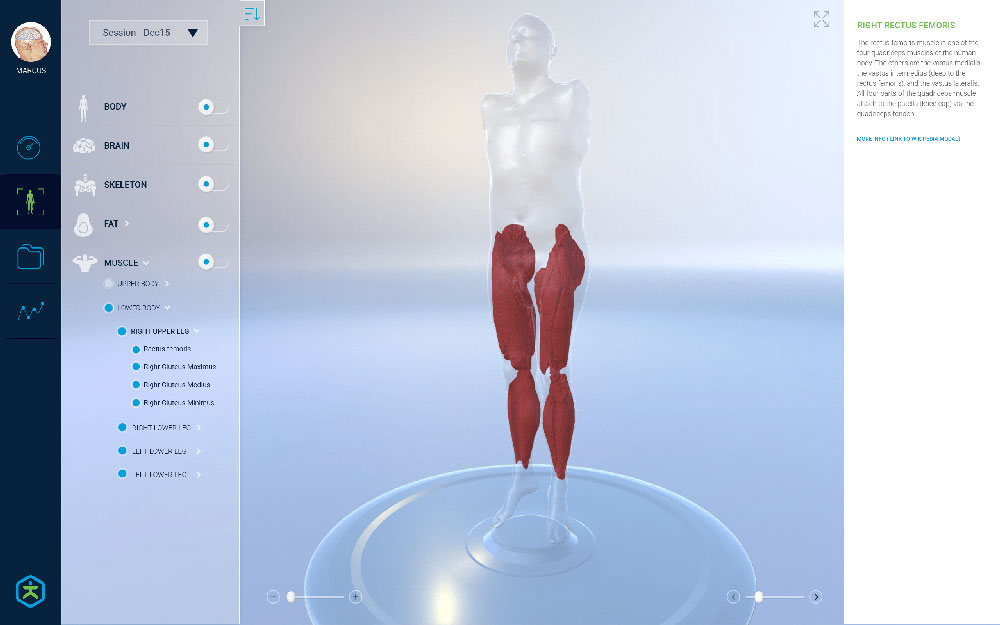
Klarismo app
A few screens from the main web application

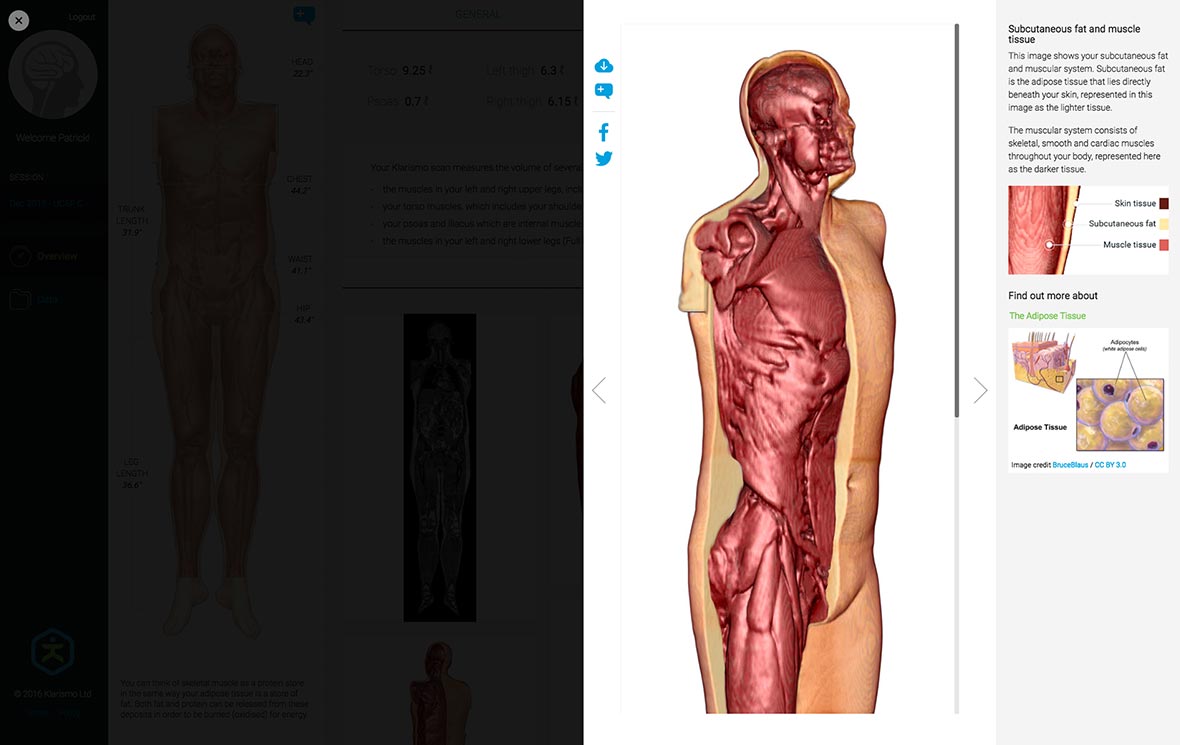


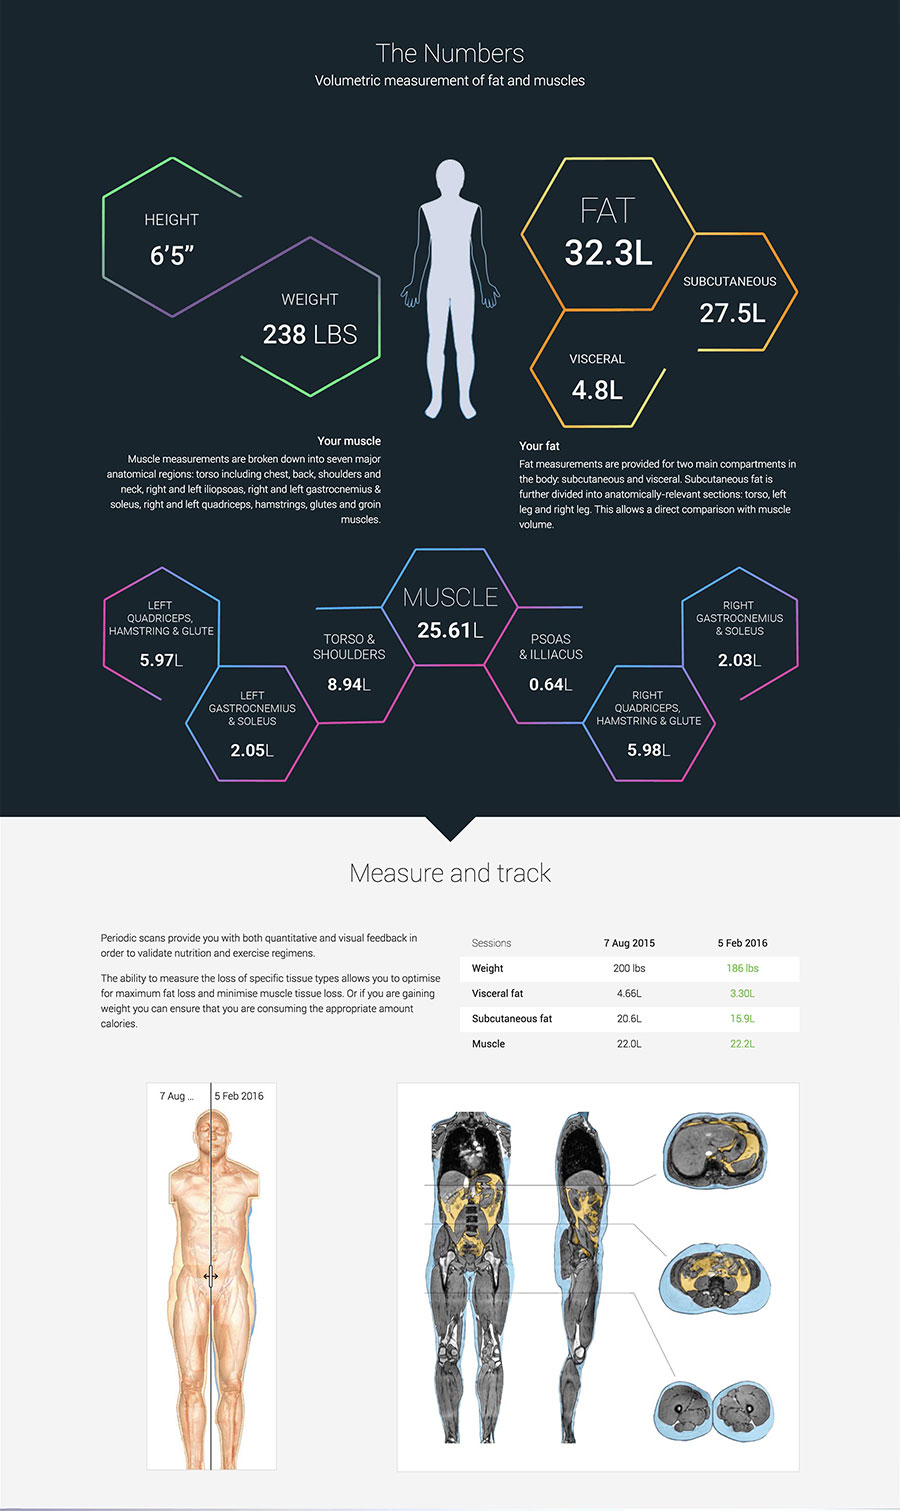
Two days after the scan the user could see on his account a large amount of information about his body. This includes body measurements, precise volumetric measurements of different tissue types and organs (fat - visceral and subcutaneous, muscle, brain, etc.) and their 3D representations.
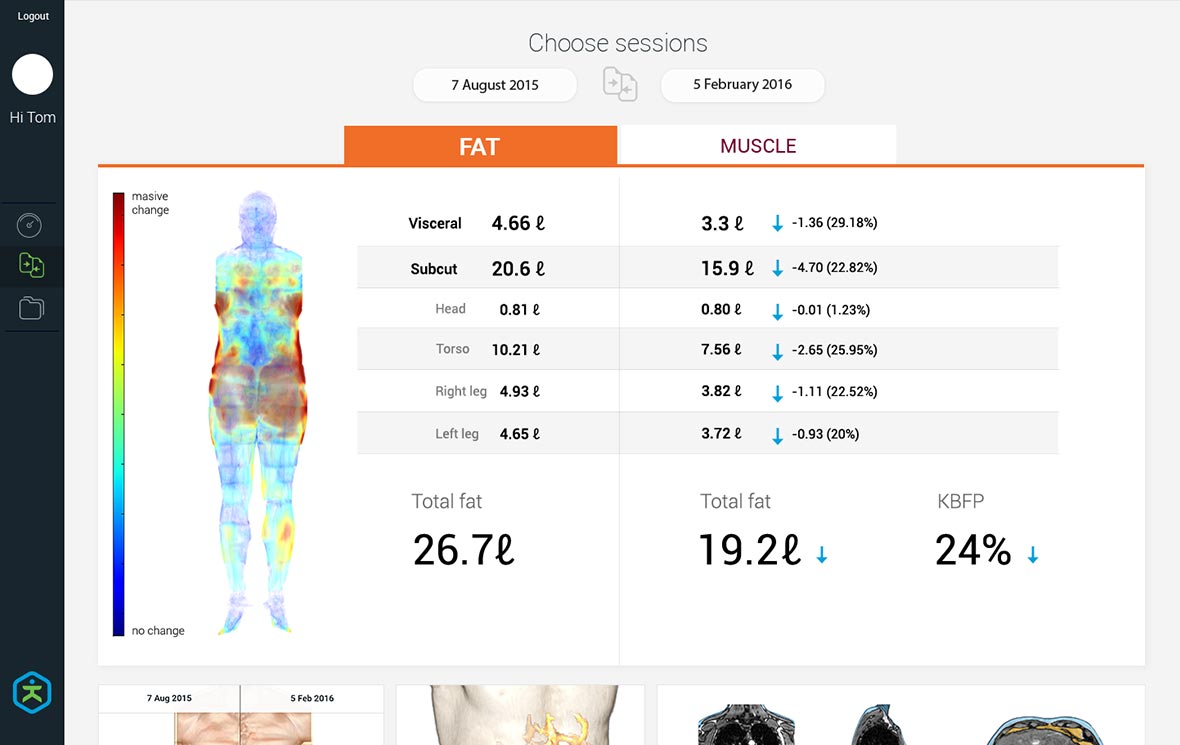
In addition to that, the user could see graphs showing comparisons between him and other people, and changes over a certain period of time by doing multiple scans. What is presented here is just the MVP of the application: it was supposed to be the go to place for insights about your body, advice on health and wellbeing, body shape predictions, 3d body exploration, plus lots of other awesome features.
3D app demo
_____
Since Klarismo uses MRI technology we were able to construct a detailed and highly accurate full 3D model of the user's body. As mentioned above, one of the app's features was supposed to be a 3D exploration of your body, where you were able to see, explore and read about each part, tissue or organ.
To showcase our capabilities I created a basic demo app with Unity, in the process discovering how powerful and fun Unity can be.
Data visualisation
A collection with some of the insights presented to the user
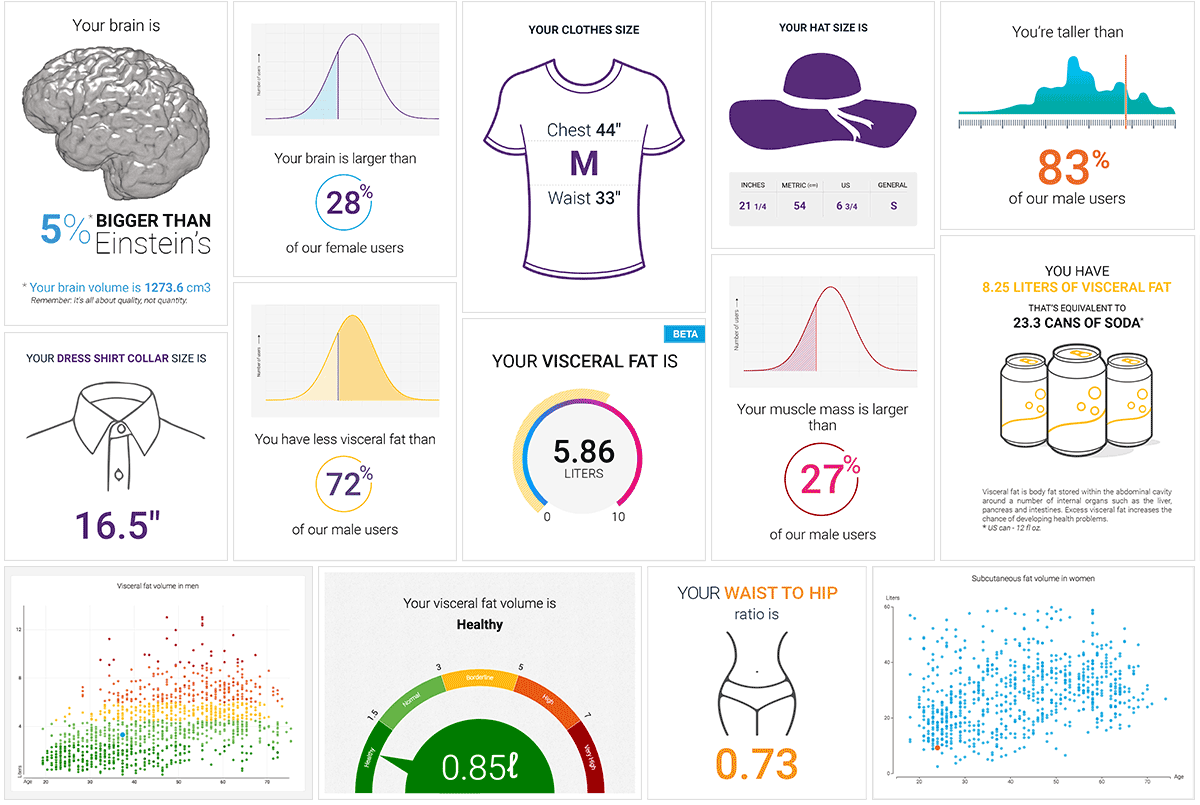
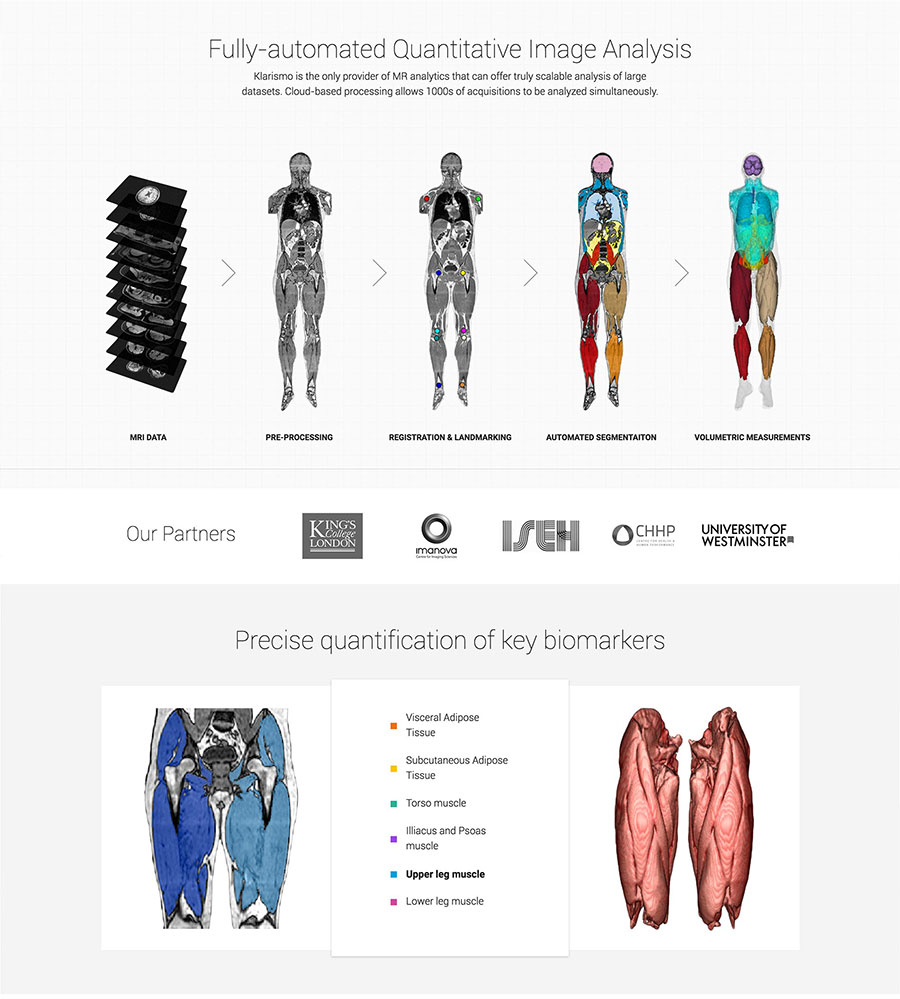
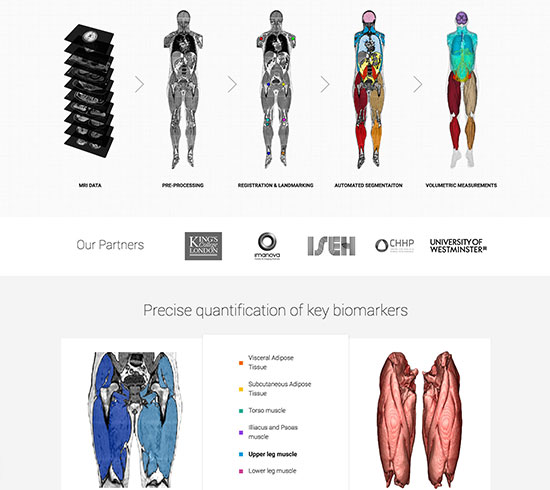
An important step in making this product viable was the automation of all the processes - from receving the raw MRI data to uploading all the 'goodies' on the user's dashboard. While developing this, we ended up creating what is probably the fastest, most reliable automated quantitative image analysis pipeline in the world (again, I worked with very talented people).
My role was to find ways in which we could automate the visualisation process. A part of the insights and graphs were created as dynamic templates, populated with the user's data using Python, and saved as images. The rest were dynamic graphs and plots created with D3.js. Also most of the visualisations were tested for different cases of colour blindness.
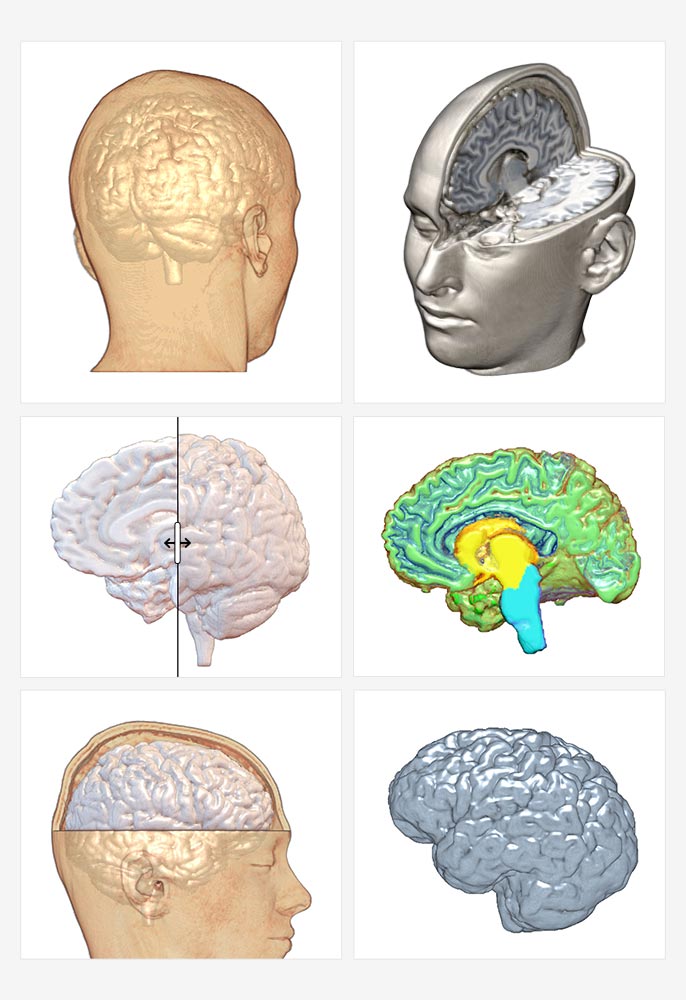
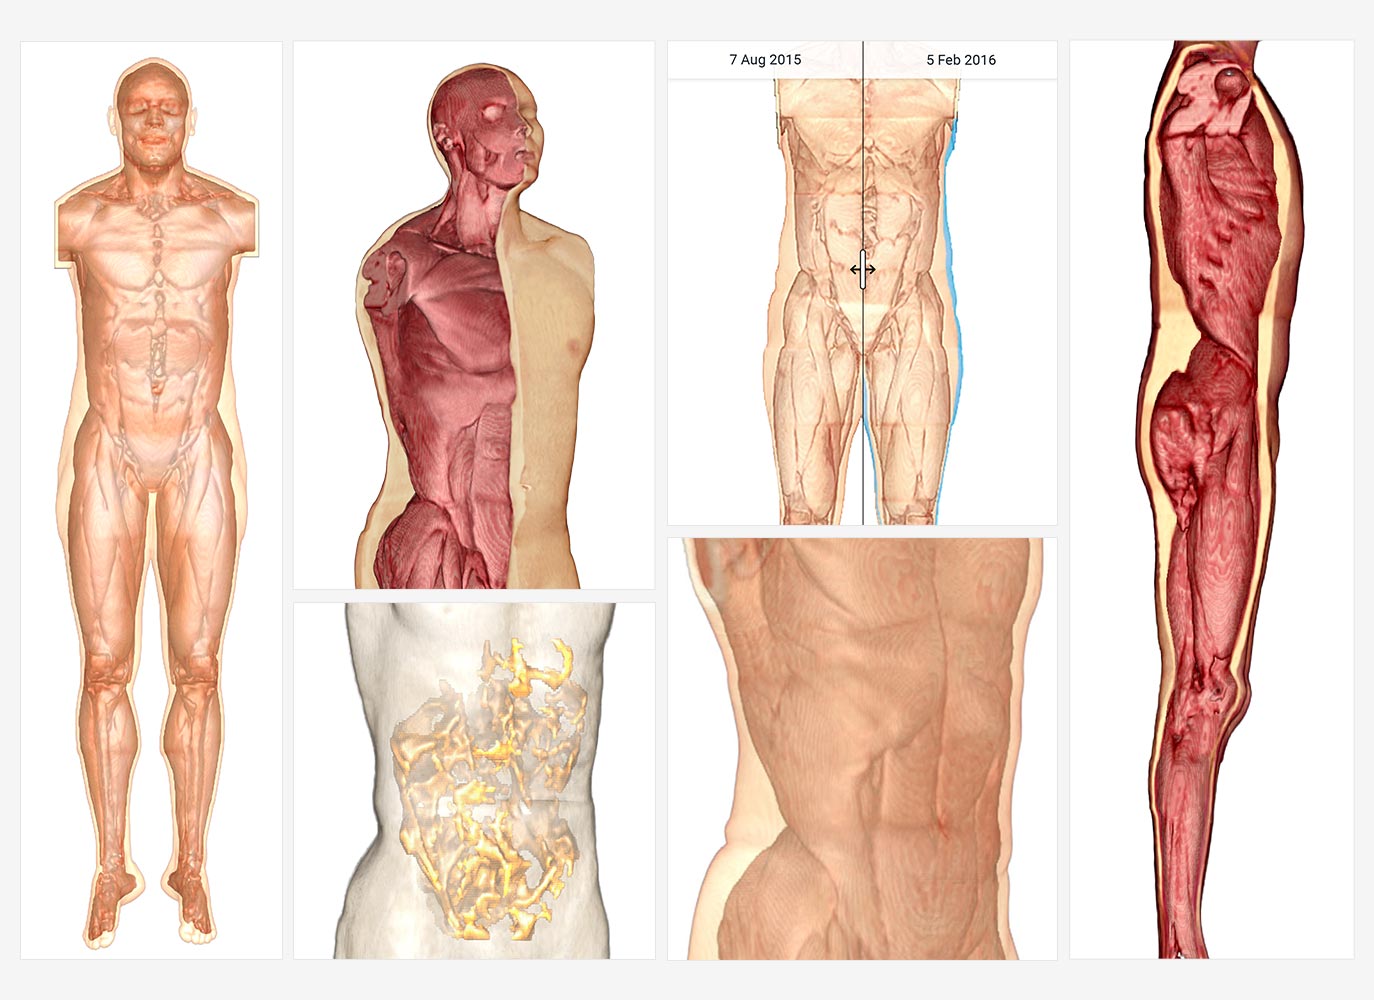
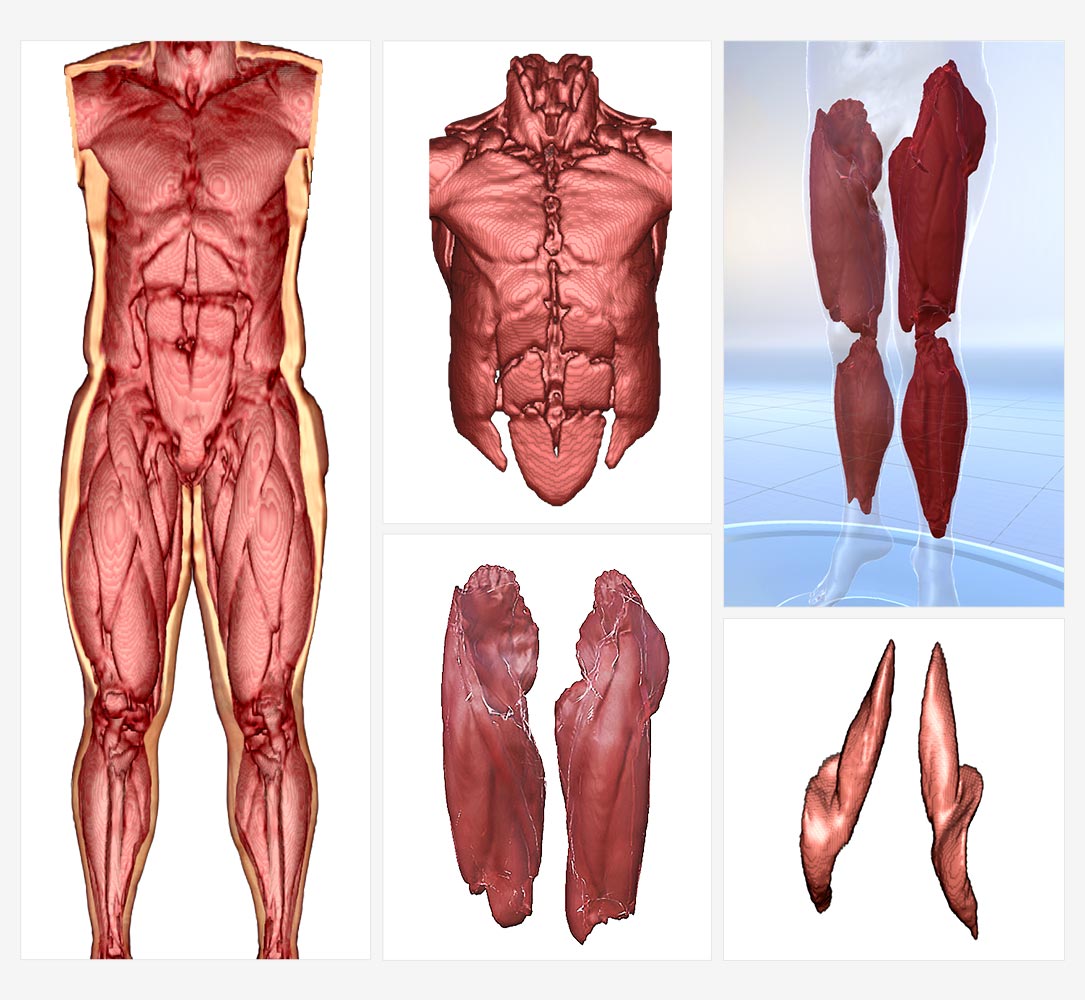
3D MRI visualisation
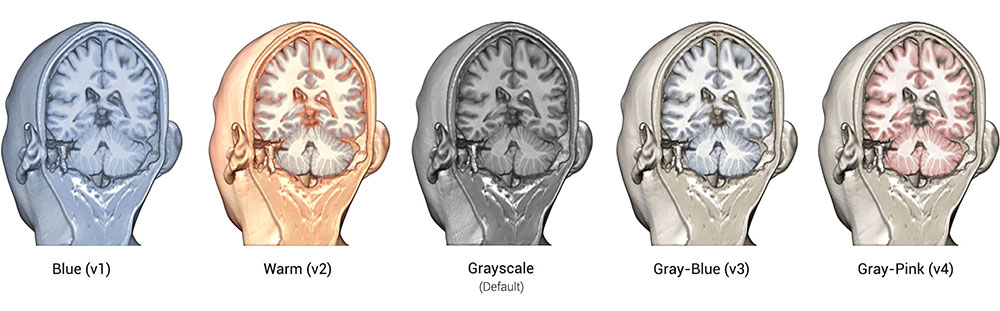
After exploring with a handfull of medical imaging software like: 3DSlicer, Osirix (Horus), ITK-Snap, MITK, we've created most of our 3D renderings in MRIcroGL - a program designed to display 3D medical imaging of the brain. I adapted it to our needs, by creating custom scripts and colour schemes.